Preprint, 18th Conference on Severe Local Storms, Amer. Met. Soc.,
San Francisco, CA, Feburary. 1996
REAL TIME PREDICTION OF STORM-SCALE WEATHER DURING
VORTEX-95,
PART II: OPERATION SUMMARY AND EXAMPLE CASES
Ming Xue1, Keith Brewster1,2, Kelvin K. Droegemeier1,2,
Fred Carr1,2, Vince Wong1, Yuhe Liu1, Adwait
Sathye1, G. Bassett1,2,
Paul Janish3, Jason Levit1,2 and Phillip Bothwell3
1Center for Analysis and Prediction of
Storms
2School of Meteorology
University of Oklahoma
Norman, OK 73019
3National Severe Storms Laboratory, Norman, OK, 73069
1. INTRODUCTION
The Center for Analysis and Prediction of Storms (CAPS) at the University
of Oklahoma has a primary mission of developing tools and methods for numerical
weather predictions (NWP) on the storm scale. CAPS envisions its research
and development effort culminating in a storm-scale weather prediction system
that can be used at regional centers or individual forecasting offices without
much retooling.
CAPS started a yearly evaluation and testing of its prediction system, known
as the Advanced Regional Prediction System
(ARPS, Xue et al., 1995), in 1993. During the first two years, ARPS
was run in a relatively simple mode, i.e., by initializing from a
single forecast sounding on a relatively small (115x115) 1 km resolution
domain. Although this type of experiment cannot predict the exact time and
location of storm activity, it is valuable in its ability to determine the
general mode of convection (Janish et al, 1995; Brooks et al.,
1993). More significant to CAPS is that these tests established a close
working relationship between CAPS scientists and operational forecasters,
and exposed the scientists to and helped them solving the logistical issues
pertaining to real time forecasting. Moreover, they paved the way for more
sophisticated experiments for 1995 and future years.
In this paper, we present a brief summary of the prediction experiment of
1995 and three sample cases, then conclude in Section 5 with a discussion.
The goals, logistic issues, computational aspects and future plans for the
experiment are given in Droegemeier et al. (1996).
2. PREDICTION EXPERIMENT DURING VORTEX-95
During the spring of 1995, ARPS was run for a 7 week period daily to produce
6 h forecasts at two resolutions, namely, 15 km and 3 km. The experiment
was carried out as part of the VORTEX-95
(Rasmussen, et al., 1994) field program. The ARPS predictions were
much more realistic than those of the previous two years in that they used
3-D initial fields on model grids that included real terrain.
The forecasts started from initial fields at 18Z. The 336x336 km2
3 km grid was one-way interactively nested within the 1200x1200 km2
15 km grid (see Droegemeier et al. 1996 for a grid layout and a data
flow chart). The 3 km grid was expected to resolve convective storms directly,
thereby explicitly predicting the storm development and propagation. The
15 km grid was to provide a set of dynamically consistent boundary conditions
for the 3 km grid while resolving meso-[beta] scale features over a bigger
domain. It turned out that the 15 km grid also had considerable skill in
predicting the location of convective activity.
Limited by the real time constraint of analysis data, the 15 km grid was
initialized using the NMC RUC 6 hour forecast interpolated to the ARPS grid.
The RUC forecast was also used to force the model boundary. The 3 km grid
was, on the other hand, initialized using analysis fields from the OLAPS
system (Brewster et al. 1994). As outlined in Droegemeier (1996),
future experiments will use analysis that is performed directly on the ARPS
grid, and will use, among others, the WSR-88D wide band radar data. An assimilation
cycle has been planned for next year.
3. OPERATION SUMMARY
The forecast fields from the 15 and 3 km grids ware made available on the
CAPS WWW page (http://wwwcaps.uoknor.edu/Forecasts) at around 18Z
and 20Z each day, respectively. The early available time of the 15 km run
was possible because the forecast from RUC (instead of analysis) was used
as the initial condition. The effects of this were twofold; on the one hand,
any error that is present in the RUC forecasts would be carried into the
ARPS forecast, on the other, in the regions where observational data coverage
is poor (e.g., western TX and eastern New Mexico), the forecast fields may
contain more mesoscale details and be dynamically more balanced than analysis
data. In at least one case, posterior prediction using analysis yielded
poorer results. The latter suggests the need for a data assimilation procedure
that can yield a set of dynamically consistent initial conditions while
maximizing the benefit of observations.
The ARPS products were generated based on discussions with the VORTEX forecasters.
Six color panels were produced at 3 hour intervals for each grid and placed
on the CAPS Web page. These fields include temperature, wind, geopotential
height, vertical velocity, horizontal moisture convergence at different
levels, sea-level pressure, surface dew-point temperature, CAPE and CIN
and accumulated surface rainfall. Three hour difference fields were also
available. In addition, VORTEX forecasters had access to the 3-D ARPS gridded
data that were converted into GEMPAK format for easy viewing and manipulation
in NTRANS. An evaluation form was designed and the assistant duty forecaster
for VORTEX was assigned to perform daily evaluation on the ARPS products.
4. SAMPLE CASES
The spring of 1995 was particular rich in storm activities. During the two
month period from early April to early June, VORTEX had operations on 18
days. Severe tornadoes were reported within the VORTEX domain on April 17,
May 7, May 17, June 2 and June 8. On all except May 7, the VORTEX field
operation was on the tornadic storms and collected rich data sets using
mobile Doppler radar, mobile mesonet, mobile soundings and airborne Doppler
Radars. ARPS became operational on April 26 and operated through June 8,
when VORTEX formally ended. Since the main interest of the forecasting experiment
during VORTEX-95 was on severe weather, we presented here as examples the
results from three of the 5 tornado days, i.e., May 7, June 8 and
May 16, 1995. Two violent tornadoes that occurred on June 2 in the far western
TX were outside the region of pre-configured 3 km grids. To be complete,
other type of events such as passing cold fronts also occurred during this
period.
4.1 May 7, 1995 multi-squall line case
On 7 May, 1995, the surface chart at 18Z was characterized by a distinct
north-south oriented dryline extending from the mid-TX panhandle to southwestern
TX. Associated with it were strong southeasterly winds on the east side
and southwesterly winds on the west. This region lay ahead of a deep upper-level
low centered west of the Rockies, with weak troughs moving northeastward
from the southwest. Deep moist air was transported northward by the flow
east of the dry line, which evolved into a 20 to 25 m/s low-level jet by
the evening (local time). Two main lines of thunderstorms occurred during
the day. In the early morning, storms originated from eastern New Mexico
(NM) and moved northeastward across the TX and OK panhandles and joined
up with a line of cells ahead of the dryline in western TX. By 15Z, these
two clusters had become a connected line in western OK and continued to
move eastward into central OK. The southern end of this line broke into
an isolated supercell later at the OK-TX border and spawned an intense tornado
on the west side of Ardmore, OK between 21Z and 21:30Z.
The second line of storms (squall line) formed between 15Z and 16Z in western
TX along the surface dryline and propagated eastward ahead of the dryline.
An HP supercell formed in the middle of this line at around 21Z at the western
OK and TX border and was targeted by the VORTEX operational team. No tornado
formed, however. This line continued to propagate eastwards while evolving
into a classic solid squall line with a trailing stratiform precipitation
region that is clearly seen in the radar reflectivity field (Figure 2a).
This squall line extended more than 1000 km and lasted for more than 10
hours while moving across OK into Missouri (MO) late in the evening. The
dryline stayed within the TX panhandle.

Figure 1. Predicted surface dew-point temperature (Cdeg.,
thin contours, interval 0.5), wind (m/s) and the 700 mb vertical velocity
(m/s, thick contours, interval 2.5) on the 15 km grid at 00Z, May 08, 1995.
Negative contours are dashed.
ARPS had an encouraging success in this day's prediction in spite of the
fast movement speed of the squall lines. In Fig. 1, the surface wind (Vsfc),
dew-point temperature (Td) fields and the 700 mb vertical velocity
(w) fields at 00Z of May 8 (6 h of prediction) are given for the
15 km grid. The Td field shows that the northern end of the dryline
remained within the TX panhandle, which agrees with the analysis. The forward
extrusion of the middle portion was, however, not observed. The analysis
showed that the southern end of the dry line was centered at x=480
km, while the predicted position was at x=660 km. This shows that
error can be introduced by the boundary conditions (RUC forecast) that are
used to force the model solution.

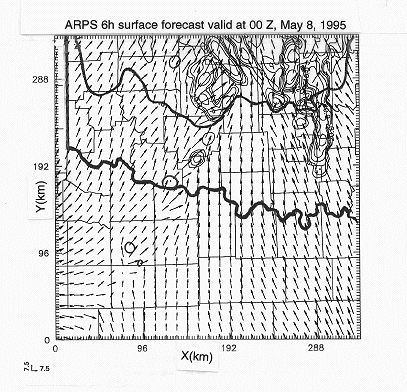
Figure 2. Observed (a) and predicted (b, in contours) low-level
radar reflectivity fields at 00Z, May 08, 1995. Panel (b) also includes
the predicted surface winds and a zero [[theta]]' contour shown in thick
lines. The squared box in panel (a) corresponds to the forecast domain in
panel (b).
At 6 h, the primary precipitation pattern (not shown) was centered north-south
in central-western OK, coinciding with a line of strong surface flow convergence
and large w at 700 mb (Fig.1). The 15 km grid was not distinctly
resolving the two squall lines, and neither did it accurately predict their
movement. This may be partly because the model was initiated after both
lines had already formed and were propagating. Some of the mesoscale forcing
might be missing in the 60 km resolution RUC forecast fields. Still, the
ARPS managed to predict the location of the main convective activity.
The 3 km prediction enjoyed a much greater success. On this day, the 3 km
domain was centered at the south-southwest OK border. Limited by its size,
it did not cover the regions of initiation (further to the west) at earlier
time. At 3 hours, one vigorous N-S line of storms (not shown) developed
in the model at the north-central part of the domain and moved toward the
northeast. By 6 hours (Fig.2b), this first line is near the northeast corner
of the domain while a second longer line (shown by the reflectivity contours
and surface flow convergence) is seen stretching from the north-central
border to the southwest corner of the grid. The second line started at about
4 h near the west boundary and made its way into the central part of the
domain. Fig.2b can be compared with the observed reflectivity field inside
the square box in Fig.2a that represents the same domain. Overall, the ARPS
3 km grid predicted the location and movement of these two squall lines
remarkably well, although storm initiation was delayed by as much as two
hours. This may not be surprising considering the less than optimal initiation
time and the limited grid size. At the same time, it suggests the necessity
for a procedure that assimilates data associated with the existing storms.
4.2 June 8, 1995 TX-OK panhandle tornadic supercell storm case.
On June 8, 1995, there existed an upper-level low over the central and northern
Rockies and a strong southwesterly flow over the central states. A deep
pool of cold air spread south across the northern and central US behind
a cold front. This cold front extended from extreme northeast NM across
southern KS and MO to New England. Very moist air persisted to the south
of the cold front, with the surface-based CAPE rising in the range of 5000-7000
J/kg in the late afternoon. The vertical wind shear was favorable for the
development of updraft rotation.
At the same time, a dryline extended north-south in the TX panhandle west
of Amarillo, intersecting the cold front at the far northern TX panhandle.
Between 18-19Z, the first storm formed near the front-dryline triple point
in the far northern TX panhandle but weakened soon as it moved northwestward
into stable air. The main activity occurred a little later in the eastern
TX panhandle as several supercells developed along the dryline at around
20-21Z and produced several large and long-lived supercells. These storms
became tornadic and remained so until at least sunset as they approached
the western OK border.

Figure 3. Predicted surface dew-point temperature (Cdeg.,
thin contours, interval 0.5), wind (m/s) and the 6 h accumulated rainfall
(mm, thick contours, interval 5) on the 15 km grid at 00Z, June 08, 1995.
Negative contours are dashed.
The above sequence of events was well predicted by the ARPS. The accumulated
precipitation from the 15 km grid at 00Z is given in Fig.3. It shows that
the heaviest precipitation occurred at the front-dryline triple point in
the OK-TX panhandle. The 3 km grid predicted the initiation of storm cells
between 19-21Z along the cold front which then turned between 21Z and 00Z
into a north-south orientation roughly parallel to the dryline. These storms
moved northeastward across the western TX-OK border into OK and exhibited
strong rotation. ARPS finished the 6 h prediction at around 2 pm (20Z) local
time, providing a 4 hour forecast lead time. In Fig.4, we compare the ARPS
predicted Radar reflectivity field (panel b) against that of the WSR-88D
(panel a) at 00Z, June 9. It can be seen that they agree remarkably well.
4.3 May 16 Kansas multiple-tornado supercell case
In the afternoon of May 16, 1995, a nearly stationary cold front stretched
NE-SW across KS and a NE-SW oriented dryline was located on the west side
of the TX panhandle. Abundant low-level moisture with surface dew-points
around 22 Cdeg. was brought south of the front and the east of the dryline.
This front-dryline pattern was similar to that of June 8. Late in the afternoon
(22-23Z), storms were initiated near the front-dryline intersection just
west of Garden City, KS and quickly became severe and developed rotation.
A right moving storm produced a number of tornadoes between 23:30Z and 2:30Z
as it moved east-northeast to near Hanston, KS. Another storm formed around
23:30Z over the extreme Northern TX panhandle at the confluent region associated
with the dryline. This storm produced large hails.
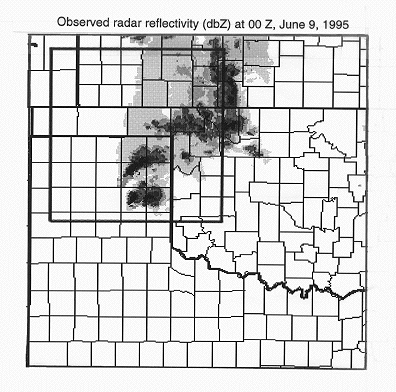
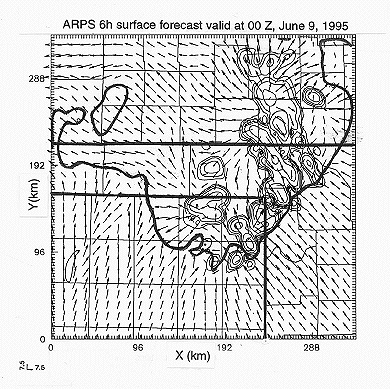
Figure 4. Observed (a) and predicted (b, in contours) low-level radar
reflectivity fields at 00Z, June 9, 1995. Panel (b) also includes the predicted
surface winds and a zero q' contour shown in thick lines. The squared box
in panel (a) corresponds to the forecast domain in panel (b).
On this day, only the 15 km ARPS run was performed. Despite the coarse resolution,
the model was able to correctly predict the location of storm activity along
the dryline and the cold front. Figure 5 shows the surface Td, and
wind and the 700 mb w fields at 6 h (00Z) from the 15 km forecast.
The front and dryline are indicated by the Td contours and the convective
activity is clearly seen in the w field. The model predicted convection
near the front-dryline triple point.

Figure 5. Predicted surface dew-point temperature (Cdeg., thin contours,
interval 0.5), wind (m/s) and the 700 mb vertical velocity (m/s, thick contours,
interval 2.5) on the 15 km grid at 00Z, May 17, 1995. Negative contours
are dashed.
5. DISCUSSION
A lot has been learn from this experiment, on both the model performance
and related logistics issues. NWP products from storm-resolving models are
still very new, and it has been and will continue to be an educational process
to both the model developers and the end-users concerning the most effective
use and best interpretation of the products. One example would be that the
fields from a high-resolution storm-resolving model often exhibit 'noise'
that in fact are resolved features of convective storms. Such 'noise' is
not commonly seen in mesoscale or large scale NWP products.
For a new model system, time is needed to establish a reliable track record
and give confidence in its predictions. When it comes to providing guidance
to the operation of field experiments, a forecaster may choose to rely more
on their own experience in nowcasting than on the model until clear superiority
in the model performance is demonstrated. This is precisely goal of CAPS.
Clearly, more detailed validation of the model results is necessary and
steps have been taken in this direction (Carr et al., 1996). More
sensitivity studies are being conducted on the model physics (Wong et
al., 1996) and more detailed studies performed on selected cases (Xue
et al., 1996). A 4DDA cycle is being added to the system that will
incorporate single Doppler wind retrieval techniques developed at CAPS.
The use of such high resolution data will be crucial in improving model
predictions. We plan to continue the prediction experiment on a periodic
basis and a proposed plan for next year can be found in Droegemeier et
al. (1996).
6. ACKNOWLEDGMENTS
This research was supported by the Center for Analysis and Prediction of
Storms at the University of Oklahoma, which is supported by NSF grant ATM91-20009,
and by a supplemental grant through NSF from FAA. Computer resources were
provided by the Pittsburgh Supercomputing Center. Further support was provided
by NOAA NSSL and SPC.
7. REFERENCES
Brewster, K., F. Carr, N. Lin, J. Straka and J. Krause, 1994: A local analysis
system for initializing real-time convective-scale models. Preprints,
Tenth Conference on Numerical Weather Prediction, Portland, Oregon,
Amer. Meteor. Soc., 596-598.
Brooks, H.E., C.A. Doswell III and L.J. Wicker, 1993: STORMTIPE: A forecasting
experiment using a three-dimensional cloud model. Wea. and Forecasting,
8, 352-262.
Carr, F. H., J. Mewes, K. Brewster and K. K. Droegemeier. 1996: Quantitative
verification of non-hydrostatic model forecasts of convective phenomena.
This volume.
Droegemeier, K. K., M. Xue, A. Sathye, K. Brewster,
G. Bassett, J. Zhang, Y. Lui, M. Zou, A. Crook, V. Wong, R. Carpenter, and
C. Mattocks, 1996: Real-time numerical prediction of storm-scale weather
during VORTEX-95. Part I: Goals and methodology. This volume.
Janish, P.R., K.K. Droegemeier, M. Xue, K. Brewster and J. Levit, 1995:
Evaluation of the Advanced Regional Prediction System (ARPS) for storm-scale
operational forecasting. Preprint, 14th Conf. on Wea. Analysis and Forecasting.
15-20 Jan., Amer. Met. Soc., Dallas, TX, 224-229.
Rasmussen, E.N., J.M. Straka, R. Davies-Jones, C.A. Doswell III, F.H. Carr,
M.D. Eilts and D.R. MacGorman, 1994: Verification of the Origin of Rotation
in Tornadoes Experiment (VORTEX). Bull. Amer. Met. Soc., 75,
995-1005.
Wong , V., M. Xue, K. Droegemeier, Y. Liu, X. Song, J. Zhang and L. Zhao,
1996: Impact of physics on the development of severe storms during VORTEX-95.
This Volume.
Xue, M. , K. K. Droegemeier, D. Wang and K. Brewster,
1996: Prediction and simulation of a multiple squall line case during VORTEX-95.
This Volume.
Xue, M., K.K. Droegemieer, V. Wong, A.
Shapiro, K. Brewster, 1995: ARPS Version 4.0 User's Guide. 380pp.
Available from the Center for Analysis and Prediction of Storms, University
of Oklahoma, Norman, OK, 73019.