Preprint, 11th Conf. on Num. Wea. Prediction
19-23, August 1996, Norfolk, VA
Ameri.
Metero. Soc., 294-296.
PREDICTION AND SIMULATION OF CONVECTIVE STORMS DURING VORTEX95
Donghai Wang1, Ming Xue1, Vince C. Wong1 and Kelvin K. Droegemeier1,2
1Center for Analysis and Prediction of Storms
2School of Meteorology
University of Oklahoma, Norman, OK 73019
1. INTRODUCTION
During the VORTEX-95 (Rasmussen et al., 1994) period, the Advanced Regional Prediction System (ARPS, Xue et al., 1995) was run daily for 6-hour real-time fore-casting on the storm scale (Droegemeier et al.,1996; Xue et al.,1996a). The model was run at 15km and 3km resolutions in a one-way nested mode. The coarse grid started from the 6h NMC RUC forecast and the boundary was also forced by the RUC forecasts. The fine grid started from OLAPS analysis (Brewster et al., 1994) and obtained its boundary conditions from the coarse grid.
A prominent case among the storm events during the period was that of May 7, 1995 (Xue et al.,1996b). Two intense squall lines occurred on that day and the operational prediction of ARPS did reasonably well. In order to better understand the initiation, structure and evolution of these squall lines, and at the same time validate the model, we conducted a set of sensitivity experiments for this case using data archived during the forecast experiment. The effects and treatment of model physical processes, the initialization time and procedure as well as the model horizontal resolu-tion as related to the ability to properly resolve convective storms are examined. The results are compared against observations.
2. MAY 7, 1995 MULTI-SQUALL LINE
2.1 Synoptic conditions
The synoptic condition on May 7, 1995 might be characterized as "synoptically evident" (Weaver et al., 1996). At 500 mb level, a powerful extratropical cyclone was moving relatively slowly through the southern Rocky Mountains, with a vigorous trough over Arizona. Consistent south-southwesterly winds existed at this level. Over central Oklahoma (OK) and Texas (TX), deep moist air was tran-sported northward by a strong low-level jet (LLJ) at 850 mb and below.
Surface features included a distinct north-south oriented dryline in eastern New Mexico. Associated with the dryline, there were strong southeasterly winds on the east side and southwesterly winds on the west side at the surface. A high value zone of convective available potential energy (CAPE) appeared on the east side, the maximum CAPE reached 3720 J/kg. At 12Z May 7, the surface loca-tion of the dryline was in the western Texas border. During the 6 hours following 12Z it moved to the middle portion of the Texas panhandle. After 18Z, the dryline moved little, except for the northern part which moved from the western end of OK panhandle to its center. On the east of the dry-line there was a high CAPE zone that moved eastward with the eastern movement of the line.In the surface pressure field, a broad region of low pressure covered southeastern Colorado, northeastern New Mexico and the TX panhandle. From 21Z May 7 to 00Z May 8, a pre-squall mesolow and a squall mesohigh associ-ated with the second squall line, were clearly identified by the Oklahoma Mesonet data, especially with in the middle portion of the line where a supercell storm was located.
2.2 Radar observations
A sequence of radar reflectivity fields shows that, in the early morning, storms which had originated in the east of New Mexico moved northeastward across the Texas and Oklahoma panhandles and combined together with a line of cells in western Texas. By 16Z, these two clusters had already become a connected line in western Oklahoma and northern Texas, and moved eastward into central Oklahoma. A storm at the southern end of this line broke off, and became an isolated supercell storm later in northern Texas. Tornadoes were observed near Ardmore of Oklahoma between 21 and 21:30Z. This first line of thunderstorms dis-sipated soon after as it moved into Missouri.
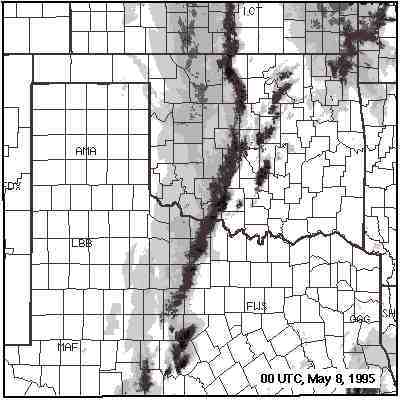
Fig. 1 Regional composite radar reflectivity fields at 00 UTC, May 8, 1995.
The second line of convection produced more precip-itation and lasted longer. Convective cells started to appear between 17 and 18Z along a north-south axis through the middle of the Texas and Oklahoma panhandle, just east of Amarillo, Lubbock and Midland, Texas. By 20Z these cells organized into a line of convection. The line moved east-ward, while individual cells in the line moved north-northeastward. A rotating supercell was prominent in the middle portion of this line at about 21Z while the line was at the western Oklahoma border. The line continued to move eastward and evolved into a classic solid squall line with a trailing stratiform precipitation region (Fig. 1). It extended more than 1000 km and lasted for more than 10 hours.
3. NUMERICAL EXPERIMENTS
In this study, the ARPS model was used in a one-way nested mode. The coarse grid had a 24-km horizontal grid spacing and the fine grid had a 6-km grid spacing. 53 levels were used in the vertical, and the vertical grid space varied from 20m at the bottom to 980m at the top. There were 21 grid levels in the lowest 2km layer. The physical domain are 4032km x 4032km and 1008km x 1008km for the coarse and fine grids, respectively.
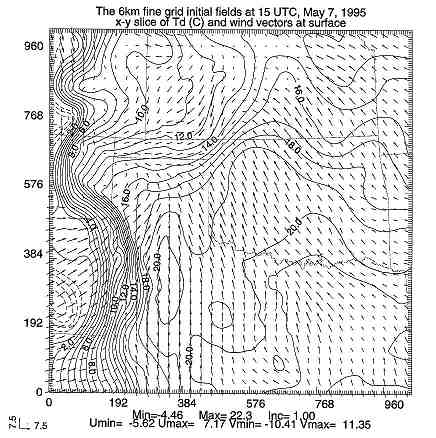
Fig. 2 The fine grid initial surface dew-point tem-perature (interval 1.0C) and surface wind (m/s) at 15 UTC, May 07, 1995. Negative contours are dashed.
Identical model physics were used on the coarse and fine grids except the moist process. They include the 1.5- order TKE-based subgrid scale turbulence and a soil model coupled with surface energy budget equations and an atmos-pheric radiation package. The coarse grid included grid-scale condensation only, while the Kessler warm-rain microphysics scheme was used on the fine grid.
Starting at 12Z May 7 1995, the coarse grid was run for 12 hours with the RUC analysis as the initial condition. The lateral boudaries were forced by linearly interpolated the 3-hourly RUC forecasts that started from 12Z.
Using ADAS(ARPS Data Analysis System, Brew-ster, 1996) analysis at 15Z, the 3-hour forecast of the 24-km grid was used as the background, the Oklahoma Mesonet data were to perform analysis. The surface and near-surface fields were most impacted by the addition of the mesonet data. This analysis was used to initialize the 6km grid. We started the 6km simulation at 15Z because the second (western) squall line formed at around 17Z and we intend to simulate the storm initiation. The surface features at 15Z are depicted in Fig. 2, By this time, the dryline had passed the western Texas boundary. A strong LLJ still existed on the east side of the dryline and the surface low pressure system was located over the Texas panhandle. Convective activities were developing around the low pressure center.
4. RESULTS
In the following, we will focus on the results from the 6-km grid at 9h, which corresponds to 00 UTC on May 8(19:00 CDT on May 7).
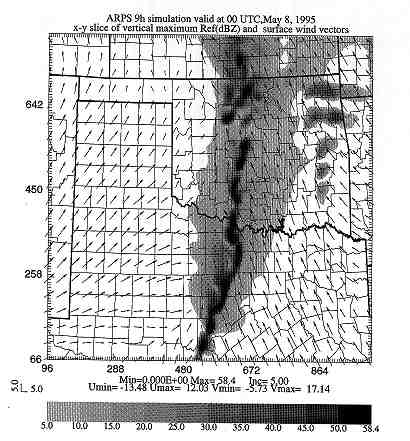
Fig. 3 The 9h simulated radar reflectivity and surface (10m AGL) wind vectors on the 6-km grid, valid at 00 UTC on May 8,1995.
The simulated radar reflectivity and surface (10m AGL) wind vectors are shown in Fig. 3. We compare this reflectivity field against that of the WSR-88D observation (Fig. 1) at the same time. It can be seen that they agree rea-sonably well. By this time, the convection in the model has evolved into a nearly solid line. In the model, convective cells first appear at 3h (18Z) in the central part of the Texas panhandle. As was observed, they formed connected line soon after and moved eastward, while individual cells in the line moved north-northeastward. Some convective cells near the northwest corner of the model grid formed also at 3h model time, which are associated with the surface low pres-sure system. Overall, the model was able to predict the ini-tiation, location and movement of the observed squall lines remarkably well.
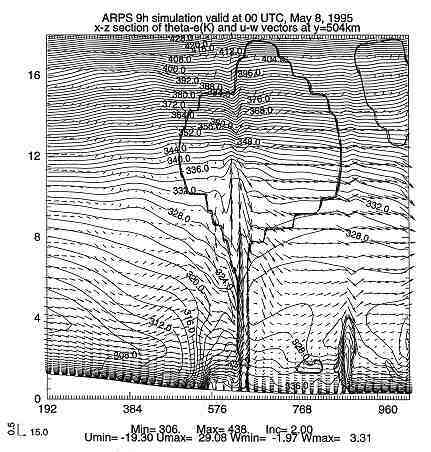
The internal structure of squall lines can be also reproduced by this 6-km simulation. In Fig. 4, perturbation potential temperature and wind vectors at the surface are plotted. The surface cold pool and associated outflow as well as the leading edge convergence (gust front) are evi-dent. At the same time, a pre-squall mesolow, a the squall-induced mesohigh and a wake low associated with the predicted squall line can also be seen in the pressure field(not shown). The east-west vertical cross section of equivalent potential temperature and the wind vectors through the center of the fine grid is given in Fig. 5. Note the distribution of equivalent potential temperature that shows the buildup of a low-level cold pool, a mid-level warm core and an upper-level cold dome. The mesoscale airflow, including the rear inflow jet, the convective updraft and downdraft, were well reproduced by the model.
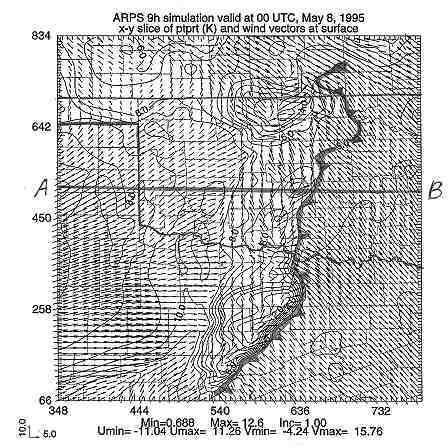
Fig. 4 Simulated surface perturbation potential tem-perature (1.0K interval) and surface wind vectors at 9h model time.
Fig. 5 The east-west vertical cross section of equivalent potential temperature (2.0K interval) and wind vectors through the center of the fine domain. Thick solid lines enclose cloudwater content larger than 0.01 g/kg.
5. SUMMARY
In this paper, the multi-squall line case during the VORTEX'95 has been further simulated using a three-dimensional nonhydrostatic model. The results demon-strated the skill of a high resolution nonhydrostatic model in reproducing the realistic small scale structure and evolution of storm systems even without Doppler radar data. We also examined effects of certain model physics, the initialization time and procedure for this case, but did not present the results here because of space limitation. More sensitivity tests and analyses are being conducted to investigate the detailed structure and physical mechanisms of the simulated systems.
6. ACKNOWLEDGMENTS
This research was supported by NSF grant ATM91- 20009 to the Center for Analysis and Prediction of Storms at the University of Oklahoma and by a supplemental grant to CAPS through NSF from Federal Aviation Administra-tion. The simulations were made at Pittsburgh Supercom-puting Center on their Cray C90 and Cray T3D.
7. REFERENCES
Brewster, K., F. Carr, N. Lin, J. Straka and J. Krause, 1994: A local analysis system for initializing real-time convective-scale models. Preprints, Tenth Conference on Numerical Weather Prediction, Portland, Oregon, Amer. Meteor. Soc., 596-598.
Brewster, K, 1996: Application of a bratseth analysis scheme including Doppler radar data. 15th Conf. on Weather Analysis and Forecasting, Norfolk, VA.
Droegemeier, K. K. et al., 1996: Realtime prediction of storm-scale weather during VORTEX-95, Part I: Goals and methodology. 18th Conf. on Severe Local Storms, 19-23 Feb., Amer.Meteor.Soc., San Francisco, CA, 6-10.
Johnston, E. C., and P. J. Hamilton, 1988: The relationship of surface pressure features to the precipitation and air flow structure of an intense midlatitude squall line. Mon. Wea. Rev., 116, 1444-1472.
Rasmussen, E. N. et al., 1994: Verification of the Origin of Rotation in Tornadoes Experiment (VORTEX). Bull. Amer. Met. Soc., 75, 995-1005.
Smull, B. F., and R. A. Houze, Jr., 1985: A midlatitude squall line with a trailing region of stratiform rain: Radar and satellite observations. Mon. Wea. Rev. 113, 117-133.
Thorpe, A. J., M. J. Miller and M. W. Moncrieff, 1982: Two-dimensional convection in non-constant shear: a model of midlatitue squall line. Q. J. Roy. Meteor. Soc., 108, 739-762.
Weaver, J. F. et al., 1996: A preliminary look at the Ard-more, OK tornado of 7 May 1995. 18th Conf. on Severe Local Storms, 19-23 Feb., Amer.Meteor.Soc., San Fran-cisco, CA, 137-140.
Xue, M., K. K. Droegemeier, V. Wong, A. Shapiro, K. Brewster, 1995: ARPS Version 4.0 User's Guide. 380pp. Available from the Center for Analysis and Prediction of Storms, University of Oklahoma, Norman, OK, 73019.
Xue, M. et al., 1996a: Real time prediction of storm-scale weather during VORTEX-95, Part II: Operation summary and example cases. 18th Conf. on Severe Local Storms, 19-23 Feb., Amer.Meteor.Soc., San Francisco, CA, 178- 182.
Xue, M., Droegemeier , K. K., D. Wang, and K. Brewster, 1996b: Prediction and Simulation of a squall line case dur-ing VORTEX-95. 18th Conf. on Severe Local Storms, 19-23 Feb., Amer.Meteor.Soc., San Francisco, CA, 169- 173.
Zhang, D. L., K. Gao, and D. B. Parsons, 1989: Numerical simulation of an intense squall line during 10-11 June 1985 PRE-STORM. Part I: Model Verification, Mon. Wea. Rev., 117, 960-994.